Polimorfizm : biblioteka kształtów
Polimorficzne zachowanie klas bardzo często tłumaczone jest na przykładzie hierarchii klas opisujących figury geometryczne: koła, kwadraty, itp. Każda z klas umie narysować swój kształt - każda inny. W tym przykładzie kształty będą rysowane w tekstowym formacie SVG, np poniżej mamy narysowane koło i kwadrat:
Zauważ, że plik w formacie ma nagłówek (element <svg ..>) oraz stopkę (</svg>).
Tworzenie hierarchii klas zaczniemy od zdefiniowania klasę bazowej Shape:
1
2
3class Shape(ABC):
4    def __init__(self, id):
5        self._id = id
6
7    @abstractmethod
Wszystkie klasy potomne odziedziczą chronione pole _id; pamiętaj o odpowiednim wywołaniu konstruktora klasy bazowej.
Klasy potomne będą również musiały zaimplementować abstrakcyjną
metodę draw(), zwracającą odpowiedni fragment tekstu w formacie SVG. Tu własnie obserwujemy zachowanie
polimorficzne: wywołanie draw() w każdej z klas coś narysuje, choć ów kształt dla każdej z klas będzie inny.
Szczególnym przypadkiem jest klasa Group, która sama z siebie nie ma kształtu; możliwe jest jej narysowanie poprzez narysowanie wszystkich
jej składowych.
Aby rozwiązać to zadanie:
dokończ klasę bazową
Shapestwórz klasy potomne, rysujące linię (
Line), koło (Circle) i prostokąt (Rectangle).stwórz też klasę
Group, która również powinna dziedziczyć poShape.stwórz klasę przechowującą styl danego elementu (tzn kształtu lub grupy)
stwórz klasę
SvgDrawing, który _rysuje_ obrazek w formacie SVG, czyli wywołuje metodędraw()z każdego z elementów i nagrywa wygenerowany w ten sposób tekst do pliku w formacie SVG
Oto zalążek kodu, wymieniający główne elementy, które należy zaimplementować:
 1# 1. Define abstract class
 2class Shape(ABC):
 3    # The base class must provide:
 4    #   - abstract method: draw()
 5    #   - protected field: _id
 6    #   - public field: style
 7    pass
 8
 9# 2. Implement classes derived from Shape
10class Rectangle(Shape):
11    # Rect must provide: x, y, w, h
12    pass
13
14class Line(Shape):
15    # Rect must provide: x1, y1, x2, y2
16    pass
17
18class Circle(Shape):
19    # Rect must provide: x0, y0, r
20    pass
21
22# 3. Create a class representing a Group, also derived from Shape
23class Group(Shape):
24    # Group must provide:
25    #   - public method: add(s: Shape) - that adds a shape to this group
26    pass
27
28# 4. Create a class to store a style:
29class Style:
30    def __str__(): pass
31
32# 5. Create a class that represents a drawing
33class SvgDrawing:
34    # SvgDocument must provide:
35    #   - public method: draw(fname: str) or draw(file)
36    #     Example solution:
37    #       def draw(self, file_obj):
38    #           if isinstance(file_obj, str):
39    #               file_obj = open(file_obj, "w")
40    #           for el in self.__my_elements:
41    #               txt = el.draw()
42    #               print(txt, file=file_obj)
43    #   - public method: add(s: Shape)
44    pass
45
46
Ukończona biblioteka klas powinna umożliwić poprawne wykonanie testu jednostkowego:
Test jednostkowy dla biblioteki kształtów
 1import io
 2import re
 3import unittest
 4
 5from svg_shapes import Circle,  Group, Line, SVGDrawing, Style
 6from svg_shapes import Rect as Rectangle
 7
 8class TestSvgShapes(unittest.TestCase):
 9
10  def setUp(self):
11        self.expected = """
12<svg height="150" width="150" xmlns="http://www.w3.org/2000/svg">
13    <rect  id="r1"  fill="#aaaaaa" x="50" y="75" width="50" height="60" />
14    <circle  id="c1"  fill="#aaaaaa" cx="75" cy="35" r="14" />
15    <g id="frame" stroke-width="1.5" stroke="black">
16	<line id="bottom" stroke="black" x1="10" y1="10" x2="10" y2="140" />
17	<line id="left" stroke="black" x1="10" y1="10" x2="140" y2="10" />
18	<line id="top" stroke="black" x1="10" y1="140" x2="140" y2="140" />
19	<line id="right" stroke="black" x1="140" y1="10" x2="140" y2="140" />
20    </g>
21</svg>"""
22
23  def test_output(self):
24    # Create styles
25    gray_fill  = Style(fill="#aaaaaa")
26    black_line = Style(stroke="black", stroke_width="1.5")
27
28    # Create main SVG drawing
29    drawing = SVGDrawing(150, 150)
30    drawing.add(Rectangle("r1", 50, 75, 50, 60, gray_fill))
31    drawing.add(Circle("c1", 75, 35, 14, gray_fill))
32
33    # Create group of elements
34    group = Group("frame", black_line)
35    group.add(Line("bottom",10, 10, 10, 140, gray_fill))
36    group.add(Line("left",10, 10, 140, 10, gray_fill))
37    group.add(Line("top",10, 140, 140, 140, gray_fill))
38    group.add(Line("right",140, 10, 140, 140, gray_fill))
39
40    # Add group to main drawing
41    drawing.add(group)
42
43    # wywołanie z plikiem
44    file_obj = io.StringIO()
45    drawing.draw(file_obj)
46    # wywołanie z nazwa pliku
47    drawing.draw("plik.svg")
48
49    output = file_obj.getvalue()
50
51    expected = re.sub(r'\s+', '', self.expected)
52    actual = output
53    actual = re.sub(r'\s+', '', output)
54
55    self.assertEqual(actual, expected)
56
57
58if __name__ == '__main__':
59        unittest.main()
Biblioteką możesz teraz tworzyć dowolne obrazy, lub wykresy, np jak ten:
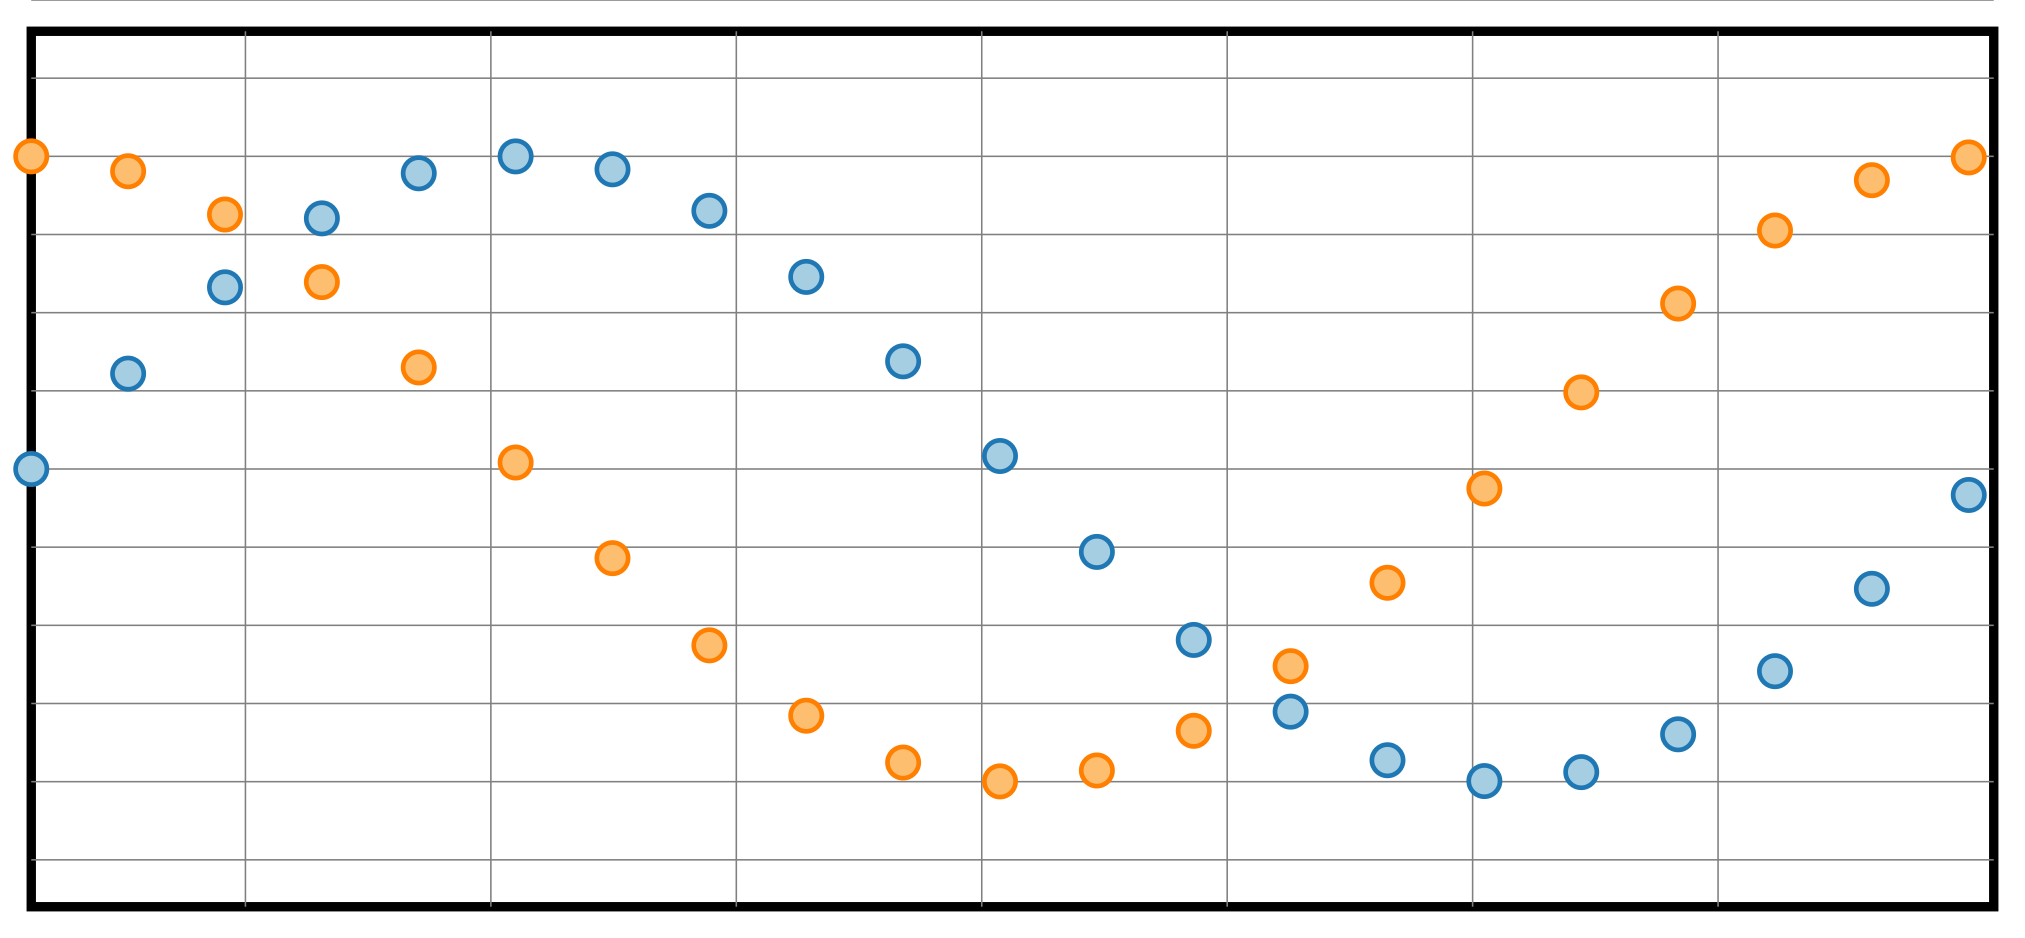
Kod programu rysujący powyższy wykres
 1import math
 2
 3from svg_shapes import Circle,  Group, Line, SVGDrawing, Style
 4from svg_shapes import Rect
 5
 6# Create the main SVG drawing again with a white background
 7drawing = SVGDrawing(648, 300) # 2*pi * 100 for the plot + 2*10 for margins
 8
 9# Define styles
10border_style = Style(stroke="black", fill="white", stroke_width="3")
11grid_style = Style(stroke="gray", stroke_width="0.5")
12sin_style = Style(fill="#a6cee3", stroke_width=1.5, stroke="#1f78b4")
13cos_style = Style(fill="#fdbf6f", stroke_width=1.5, stroke="#ff7f00")
14
15
16# Draw rectangular border
17drawing.add(Rect("r1", 10, 10, 628, 280, style=border_style))
18
19# Create a group for the grid
20grid_group = Group("grid", grid_style)
21
22# Add grid lines every pi/4 on X-axis and every 0.25 on Y-axis
23for x in range(1, 8):  # X every pi/4
24    grid_group.add(Line(f"lx{x}", x*math.pi/4*100, 10, x*math.pi/4*100, 290))
25for y in range(0, 300, 25):  # Y every 0.25
26    grid_group.add(Line(f"ly{y}",10, y, 638, y))
27
28# Add the grid group to the drawing
29drawing.add(grid_group)
30
31# Create groups for sin and cos points
32sin_group = Group("sin", style=sin_style)
33cos_group = Group("cos", style=cos_style)
34
35# Add points for sin and cos functions, sampled every pi/10
36for i in range(0, 628, 31):  # Sample points every pi/10
37    x = i / 100  			# x - function argument
38    sin_y = 150 - (100 * math.sin(x))  	# Scale sin values to fit in the canvas
39    cos_y = 150 - (100 * math.cos(x))  	# Scale cos values to fit in the canvas
40    sin_group.add(Circle(f"s{i}", i + 10, sin_y, 5))  # Add sin point
41    cos_group.add(Circle(f"c{i}", i + 10, cos_y, 5))  # Add cos point
42
43# Add sin and cos groups to the drawing
44drawing.add(sin_group)
45drawing.add(cos_group)
46
47drawing.draw(None)
48